In the heart of China, where the Yangtze River winds its way through vast expanses of farmland, a groundbreaking study is set to revolutionize agricultural drought monitoring. Led by Xinyi Lan from the Key Laboratory of Geographical Process Analysis & Simulation of Hubei Province at Central China Normal University, the research introduces a novel approach to tracking agricultural droughts, integrating vegetation response and meteorological dynamics. Published in the journal *Ecological Indicators* (which translates to *生态指标* in Chinese), this work promises to enhance our understanding of drought impacts on crop growth and yield prediction.
Droughts have been increasing in frequency, duration, and extent over the past few decades, posing significant threats to ecological health, food security, and social stability. However, until now, there has been no uniform and feasible agricultural drought monitoring index that can accurately capture the lag and spatial–temporal differences of agricultural droughts while integrating the impacts of drought stress on crop growth. Lan and her team have addressed this gap by investigating the response of remote sensing vegetation indices to meteorological droughts and constructing standardized comprehensive agricultural drought indices (CADIV, CADIS, and CADI3) through Copula-based multivariate modeling.
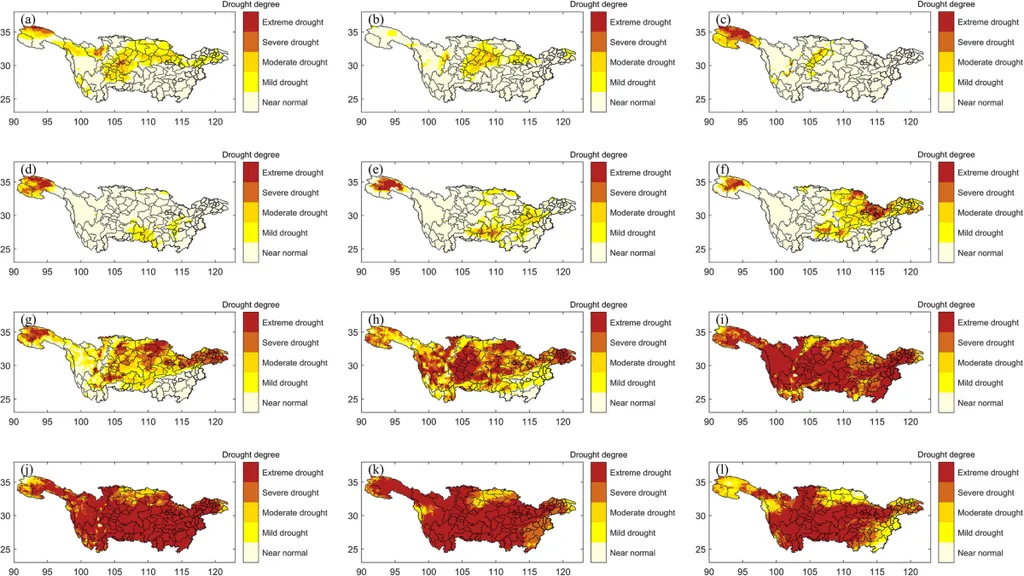
The study applied run theory, combined with historical drought records, to analyze the temporal and spatial distribution of agricultural droughts in the middle and lower Yangtze River Basin from 2000 to 2021. The findings revealed that remote sensing vegetation indices show similar temporal patterns and strong correlations with meteorological drought, effectively capturing vegetation anomalies under drought stress. “The CADI can effectively capture both meteorological and agricultural droughts, as well as the lagged and cumulative responses of vegetation,” Lan explained. Among the indices, CADIS successfully identified six major drought events, with a consistency rate of 76.34% with agricultural droughts, an omission alarm rate of 2.56%, and a false alarm rate of 0, demonstrating the highest stability in applicability assessments.
From 2000 to 2021, drought conditions in the region exhibited a gradual alleviation trend, but anomalous extreme drought events occurred intermittently, with seasonal droughts frequently observed in autumn and winter. The frequency of mild and moderate droughts ranged from 26.76% to 34.89% and 17.99% to 32.60%, respectively. These findings provide valuable insights for monitoring and more accurate agricultural yield prediction, which is crucial for the energy sector, particularly in regions heavily reliant on agricultural biomass for energy production.
The implications of this research are far-reaching. By delivering information on the transition from meteorological to agricultural drought, the study offers a robust tool for policymakers, farmers, and energy producers to better manage resources and mitigate the impacts of droughts. As Lan noted, “Our results are expected to provide valuable insights for monitoring and more accurate agricultural yield prediction, which is crucial for the energy sector, particularly in regions heavily reliant on agricultural biomass for energy production.”
This innovative approach to drought monitoring is set to shape future developments in the field, offering a more comprehensive and accurate method for assessing the impacts of droughts on agriculture. As climate change continues to exacerbate drought conditions, the need for such advanced monitoring tools becomes increasingly critical. The research published in *Ecological Indicators* marks a significant step forward in our ability to understand and respond to the challenges posed by agricultural droughts, ensuring food security and stability in the face of a changing climate.

