In the heart of Morocco’s Tadla plain, a groundbreaking study is reshaping how we understand and combat soil salinity, a silent menace that stifles agricultural productivity and threatens land sustainability. The research, published in *Frontiers in Soil Science*, combines the prowess of machine learning (ML) with the reach of remote sensing to map soil salinity with unprecedented accuracy. This isn’t just about creating maps; it’s about empowering farmers and policymakers with data-driven insights to make informed decisions.
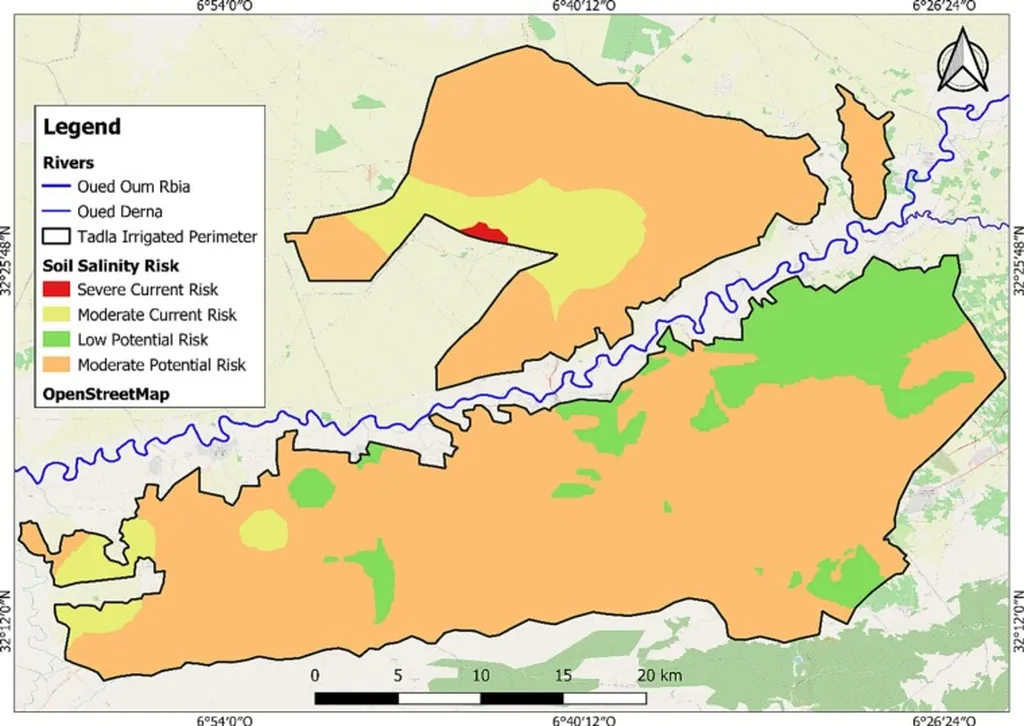
The study, led by Abdelwahed Chaaou of the International Water Research Institute at Mohammed VI Polytechnic University (UM6P), focuses on the Béni Amir Sub-perimeter. Here, soil salinity varies widely, with electrical conductivity (ECe) ranging from 0.84 to 10.28 dS/m. This variability poses significant challenges for agriculture, but it also presents an opportunity for targeted interventions.
Chaaou and his team harnessed the power of Landsat-8 OLI satellite data, extracting a suite of predictors including salinity indices, intensity indices, brightness index, and reflectance values. To tackle multicollinearity, they standardized and transformed these variables using Principal Component Analysis (PCA). The real innovation, however, lies in their application of four ML algorithms: Random Forest (RF), K-Nearest Neighbors (KNN), Support Vector Regressor (SVR), and Multi-Layer Perceptron (MLP).
The results are striking. KNN emerged as the top performer, achieving a mean coefficient of determination (R²) of 0.75 and a Root Mean Square Error (RMSE) of 0.61 dS/m. “The KNN model’s accuracy was remarkable,” Chaaou noted. “It revealed a consistent southwestward increase in salinity, aligning with the regional hydraulic flow.”
The resulting maps paint a clear picture of the salinity landscape. KNN classified 49% of the area as moderately saline, 22% as slightly saline, and 20% as non-saline. Strongly and extremely saline classes covered 8.4% and 0.6%, respectively. Other models like RF, SVR, and MLP showed comparable trends, with moderately saline areas ranging between 30-41%.
So, what does this mean for the agriculture sector? Precision is key. With accurate soil salinity maps, farmers can make data-driven decisions about crop selection, irrigation strategies, and soil management practices. This isn’t just about mitigating losses; it’s about optimizing yields and ensuring long-term sustainability.
The commercial impacts are substantial. By identifying saline areas, farmers can avoid planting salt-sensitive crops and instead opt for more resilient varieties. This targeted approach can lead to significant cost savings and improved productivity. Moreover, policymakers can use this data to allocate resources more effectively, implementing targeted interventions to combat soil salinity and support agricultural development.
Looking ahead, this research opens doors for future developments. The integration of ML and remote sensing data offers a scalable solution that can be applied to other regions facing similar challenges. As Chaaou puts it, “This approach can be replicated in other semi-arid regions, providing valuable insights for agricultural management and land sustainability.”
In the fight against soil salinity, data is a powerful ally. By leveraging the combined strengths of machine learning and remote sensing, we can turn the tide on this silent threat, ensuring a more sustainable and productive future for agriculture.